Node Provider Troubleshooting
Troubleshooting individual Nodes
- Possible Node Onboarding Errors
- Failed NNS proposals - finding the cause
- Troubleshooting Unhealthy Nodes
- Troubleshooting Switches
- Troubleshooting Packet Loss Issues
- Troubleshooting Interface issues
- Updating Firmware
- iDRAC access and TSR logs
- Getting a shell during Node (SetupOS) installation, to troubleshoot a failure:
- Hit enter until you see a login prompt
- Log in with user
rootand empty password - Type
systemctl stop setupos- it will auto-reboot if you don't do this - Now you have root access for diagnostics, etc
Node Status on the Dashboard
The dashboard provides real-time status of each node in the network. Nodes are identified by the principal of the currently deployed operating system, so the principal of the node will change upon node redeployment. Node Providers are expected to maintain a private record correlating each server with its principal. This record is crucial for tracking, especially when nodes are redeployed with new principals.
Metrics and Monitoring
Metrics are collected from nodes situated in three key geographical locations: Frankfurt (FR1), Chicago (CH1), and San Francisco (SF1). Each location is equipped with an independent monitoring and observability system. These systems apply specific rules to identify normal and abnormal node behaviors.
Alerts and Troubleshooting
When a node exhibits abnormal behavior, an ALERT is triggered by the monitoring system. The nature of the alert is indicated on the dashboard under the node's status.
In the event of an ALERT, follow the provided troubleshooting steps. If your issue and solution are not listed, please contribute by adding them to the page.
The dashboard indicates four possible statuses for each node:
- Active in Subnet - The node is healthy and actively functioning within a subnet.
- Awaiting Subnet - The node is operational and prepared to join a subnet when necessary. Node providers still get full rewards for the node.
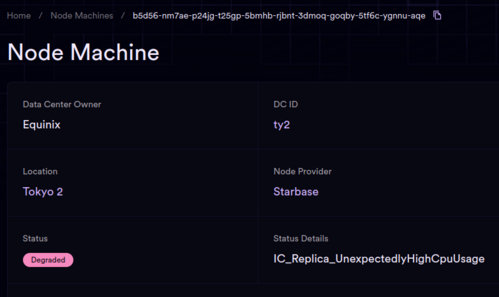
- Degraded - Metrics can be scraped from the node, indicating it is online, but an ALERT has been raised. This status suggests the node may be struggling to keep up with network demands. Intervention from the node provider and following the troubleshooting steps should be followed to resolve the issue. If you need to remove a node from the registry to service it, see Removing a Node From the Registry
- Offline - The monitoring system is unable to scrape metrics, possibly due to node failure or data center outage. Prioritize verifying network connectivity and hardware functionality. Troubleshooting steps should be followed to resolve the issue.
- Not listed at all. A missing node from the list may indicate significant issues, requiring immediate attention and troubleshooting. Troubleshooting steps should be followed to resolve the issue.
Checking Node CPU and memory speed
Some server machines run slower than they should, and they may also become slower after certain events (such as power loss) due to firmware bugs, they may have a faulty power supply, insufficient power supply redundancy, etc.. If you suspect that this is the case, you can run the following test on the machine. You can prepare a live Ubuntu USB stick and boot the server from it. Make sure you don't install Ubuntu on the machine and wipe the disks, since you will have to redeploy your node if you do this. You only want to try Ubuntu.
Once you boot from the live Ubuntu image, you can install some packages to it. They will live in memory only and will be gone once you reboot the machine. The test that we found particularly valuable to determine if the problem is present was sysbench. Install it with sudo apt install sysbench and then
sysbench --test=memory run
on the machine (HostOS) and look at the memory transfer speed. Memory speed should be at least 5.6GB/s. If you get less than that, please consult your vendor how to increase the speed to the appropriate level. For instance, with some Dell servers we were seeing 2.6GB/s memory speed and had to upgrade the CPLD firmware to resolve the performance issue. For some SuperMicro servers we have seen improvements by power cycling the server & changing the BIOS setting, Advanced > ACPI Settings > ACPI SRAT L3 Cache As NUMA Domain to Disabled.
Changing your Node Provider principal in the NNS
Please refer to Node Provider NNS proposals
Changing a DC principal
Please refer to Node Provider NNS proposals
Node Provider Matrix channel
Discuss your issue with other Node Providers in the Node Provider Matrix channel.
Back to Node Provider Documentation
